Results 1 to 7 of 7

Thread: OPS: Can We Do Better?

  1. #1

    OPS: Can We Do Better?

    Baseball has long been a game based in statistics. Henry Chadwick devised the box score over 100 years ago, and since then, players have been judged by statistics. Cars were won with batting titles and baseball resurged after the Black Sox scandal on the power of the rarely used HR, when Ruth made it the ideal hit rather than an ignored facet of the game. Since then, statistics have only become more important. Records cause some of the most heated debates, almost all honors are based on the statistics of how well a player performs, and there is a whole section of baseball fandom based in statistics: fantasy baseball.

    At this point, possibly the favorite offensive statistic of the somewhat educated fan is OPS and it’s easy to see why. It’s an easily calculated stat, you simply add on-base percentage and slugging percentage together. It’s easily comparable between two players, since both stats are relatively independent of teammates. The adjusted versions of the stat are available on the internet, and the unadjusted stats are updated daily. It also helps that OPS has a good correlation to runs scored by a team, especially for a stat that isn’t created by Baseball Prospectus or Bill James. Simply put, it includes patience and power and produced a compiled stat that actually seems to judge players fairly.

    But OPS should be able to be improved. Logically, the main problem with OPS is the weight it gives to slugging over on-base percentage. Both slugging and OBP have a solid correlation to runs scored and produced. Most results show that there is not much of a difference between the two stats in terms of how they correlate to runs scored. However, Slugging gets a noticeably higher weight in OPS, as compared to OBP. The nature of the stats is that almost every player who is not a singles hitter is going to have a higher slugging percentage, simply because total bases add up faster than walks do. Therefore, OPS gives more influence to slugging than to OBP.

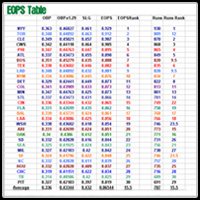
    There are two solutions that jump out at me right away to test out. The first is a relatively obvious one, simply multiply OBP by a specific number to give it equal weight to slugging, and add the results together to get an Equal OPS (EOPS for the purposes of the article). For the numbers presented (based on 2006 team statistics), I’ll make the multiplier 1.29, as that number multiplied by the league average OBP would equal league average slugging. That would logically equalize the value of slugging and OBP and produce a state more likely to correlate to runs.

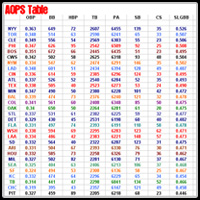
    The second solution is a bit more exploratory on my part. The essential idea is that slugging would also recognize walks. Currently, slugging is Total Bases divided by At-Bats, a quick and easy calculation. However, we all know that walks count just the same as a single in terms of what total bases would calculate. Total bases doesn’t account for if a runner on base takes an extra base, rather simply what the hitter accomplishes. Therefore, I will also count a walk and a HBP as one total base, equal to a single. Additionally, stolen bases are not added in and neither are CS. The new formula would be (TB+BB+HBP+SB-(2*CS))/(PA). I had a tough time deciding between CS and 2*CS, mostly because the team only loses one overall base when a player is CS from 1st to 2nd. However, since I am comparing for runs, and the break-even point is 66%, 2*CS seems more accurate. I will call this SLGBB (Slugging with BB) and AOPS (Adjusted OPS). AOPS is simply OBP + SLGBB.

    Since I have no real statistical skills and can’t come up with actual statistical terms or concepts, my ranking system will use the ranks of the teams over the entire major leagues. For instance, if a team is ranked 5th in OPS, 3rd in EOPS, and 8th in AOPS, and they ranked 4th in runs, the EOPS and OPS would equally correlate and AOPS would be way off. Also, I’m only looking for a stat that doesn’t require a degree in mathematics to understand, so my formulas will try to be accessible.

    Also, since this is simply exploratory, I will only do one year, so be warned that this is a small sample statistically and that if I tested 2003, the results could and probably would be different, as if I tested 1947.

    OPS Results


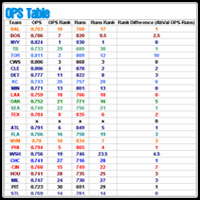
    The OPS Results turn out a good correlation to runs from the 2006 data. On average, without removing any outliers (Toronto’s ten rank difference is the most notable), there was a 2.4 difference in rank, on average. Five teams turned out to be exactly the same in both OPS and Runs rankings, six if you include tied teams as either ranking (Los Angeles was 9th in OPS and Tied for 9th in runs, which I made 9.5). The data tended to be more accurate for the teams at the top of the OPS and runs ranking as compared to the teams near the bottom and in the middle. That is most likely due to the 40-point difference between 1st and 10th, and the 50-point difference between 11th and last, which resulted in closer raw differences between the teams near the middle and bottom. All the perfect teams were within the Top 18 teams, which supports that idea.

    EOPS Results


    The EOPS numbers look very similar to the OPS numbers. They have the same major outliers (Toronto at a 10-rank difference, Cincinnati at a 7-rank difference, and Kansas City at a 6-rank difference). In fact, with the OPS and AOPS columns sorted by rank, there were no differences greater than one spot between the two calculations. For instance, Florida and Baltimore flipped spots from the OPS to the EOPS, as did a couple other teams, but all in all, the equaling of the weight of the two numbers had little impact on the overall results in comparison. The overall rank difference was a total of 71, meaning each team was off by an average of 2.37 ranks. Essentially, if any one team were off by one more ranking in the EOPS ranks, the correlation would be equal. There was not a major difference between these two ranking systems and the effort to calculate the EOPS of a team is unnecessary when comparing them, as OPS will be just fine in comparison.

    AOPS Results


    The AOPS Numbers, which left OBP alone while tinkering with slugging, were a huge flop. The average rank difference was 3.5, basically a full rank more than either OPS or EOPS. The formula maintained the same factors that made Toronto and Kansas City exceptions to the rule. However, it simply inflated the problems of teams like Cincinnati (which ballooned from a seven rank difference to a thirteen rank difference) and Arizona.I thought that adding the factors of walks and HBPs into slugging would have made the results more concurrent, but the rankings show significant regression in terms of accuracy when using AOPS.

    EAOPS Note


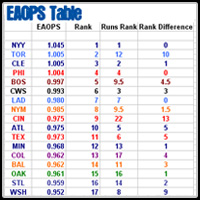
    I did a quick calculation combining the general idea of the two “test” OPSes. First I determined AOPS, and then I found the number to multiple OBP by to make it equal. The produced the EAOPS results. The results were the exact same as the AOPS result. That means that the increased difference between SLGBB and OBP was not the culprit. The EAOPS multiplier was 1.43, resulting in a formula of (1.43*OBP)+(AOPS).

    Conclusion and a calculation of Ratio


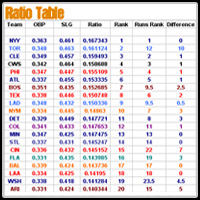
    In conclusion, in spite of my best efforts, OPS either has more correlation or equal correlation to runs as compared to my test OPSes. A quick calculation of Ratio (SLG*OBP) produced results better than OPS or EOPS, but not significantly by any means, with an average rank difference of 2.37. The Ratio Results are placed above this paragraph

    OPS is a flawed stat, but with a very small average difference between the real runs produced and the OPS predicted runs produced and the lack of a better option found among my calculations, OPS seems like a fair tool to use when predicting future success in terms of team runs scored.

    Thanks to Mission for making the tables color coded and available for use in the article. Comments are welcome.

  2. #2
    AUTOBOTS, ROLL OUT! Molina00's Avatar
    Join Date
    Feb 2006
    Location
    Central Oklahoma
    Posts
    4,594
    MLB ERA
    6.13

    Re: OPS: Can We Do Better?

    Great job Fish. I like the EOPS calculation. Not just because it's easy but it made the most sense to me, trying to put OBP on equal ground with SLG. Too bad your tests didn't come up with more the kind of results you were looking for.

    I did everything but facebook on this because I don't have an FB account.
    Integrity can accommodate the inadvertent error and the honest difference of opinion; it cannot accommodate deceit or subordination of principle.


    LeagueTeamRecordStandingDivision TitlesWild CardLDS WinsLCS WinsWS Wins
    MSLRangers27-111st2731772
    PSLJedi31-448th00000

  3. #3
    RIP Cyan 2000 - 2017 Providence A's's Avatar
    Join Date
    Apr 2005
    Location
    PVD for now.
    Posts
    26,602
    MLB ERA
    3.08

    Re: OPS: Can We Do Better?

    good work bro. I'll have to give it a more thorough read later, but you definitely put a lot of effort into that. I don't think we'll ever have a statistic that will accurately predict anything 100% of the time, but OPS certainly can give you a close idea as you say. Thanks!

  4. #4
    14,558 Unread Posts browntown653's Avatar
    Join Date
    Apr 2005
    Posts
    11,666
    MLB ERA
    2.44

    Re: OPS: Can We Do Better?

    Excellent idea here provides for a very good article. Nice job, digged.
    I did a lot of good things as a sim league GM.

    Ah, give me something clever to say here.

  5. #5
    Guess Who's Back missionhockey21's Avatar
    Join Date
    Mar 2005
    Posts
    18,014
    MLB ERA
    1.56
    Blog Entries
    8

    Re: OPS: Can We Do Better?

    First off, fantastic article Fisher. This is the EXACT type of article we need on this site. Any piece of writing that can get us to question the accepted standards of the game we love, so we can pursue a more in-depth, a more informed appreciation is just something I love to see.

    And that is exactly what OPS is to the game, as you mentioned, it is among the first of the statistics that an informed fan will go to so they can compare the offensive value of two players. A lot of the newer statistics, or more rarely used statistics of a Bill James for instance, is something I have to think about going to use.... it isn't there in my head like OPS is, because it isn't accepted as much as OPS is. OPS is extremely easy to like and to understand as it obviously combines the two most crucial elements to run creation in one tidy comparable stat, a player's ability to get on-base and a player's ability to have their feet find as many bases as humanly possible. Even the plateau for an elite player is easily distinguishable (really upper echelon players, 1.000+), so it's not only easy but it's pretty in that regard as a player who gets over that hump, really seems to gain a special aurora about them as a player (whether it has anything due to the statistic or just what the stat represents is another debate for another time.) But given how much OPS has worked it's way into the common fan's lingo, that makes it a time consuming process to eventually question and seek an even better evaluator. I am sure one might exist, but OPS isn't flawed to the point where it's broken and it seems like in spite of what the inquisitive and curious mind would speculate, it's simplicity that works without TOO many complaints.

    Looking at the OPS table, I wonder if it would be possible to devise some sort of team clutch rating. Because to me, and this could be sleep depravity talking, OPS is a fairly good correlation between runs scored but the teams who differ in placement to a somewhat significant degree is obviously getting runners on and hitting for some sort of power, but is not capitalizing on their chances as much (of course.) EOPS and OPS being pretty similar was not all that shocking (although I think EOPS might be a better measure in some regards), I was completely surprised with the loss of accuracy when using AOPS as from the outset, it sounded very solid.

    Very interesting article Fish, you should consider using a few of your formula's as player evaluators and see how they might differ for instance in ranking compared to runs created (as a higher OPS naturally leads to a higher RC/27 output.) Keep up the great work.

    +rep
    Digg'ed and sent off to YardBarker.

  6. #6

    Re: OPS: Can We Do Better?

    I was honestly surprised when AOPS just accentuated the problem. Maybe I shouldn't have been, since I did increase the number significantly which would highlight a problem. However, I figured that adding data that seemed pertinent to scoring runs or that seemed fair in evening out a discrepancy between Patience and Power would have made it correlate better to runs. For whatever reason, either Small Sample Size, Luck, or (most likely) the formula not being apt for the situation, it just didn't work.

    I do think that, if I kept doing EOPS and OPS as a comparison throughout the years, that EOPS would show itself to be superior. Maybe not as good as Ratio (which was the best of the five in spite of being a last minute calculation), but a small difference would appear as OBP's weight is increased. I don't have that faith anymore in AOPS.

    I would definitely consider taking the Top 25 players in OPS at year's end and then converting it to EOPS and Ratio to see how they change in ranking. Obviously, it would favor more of the patient hitters rather than power ones, but still, I would be interested to see what happens, using RC/27 as a control, like Runs were in this article.
    http://strike3forums.com/forums/phot...pelbon2006.jpg


    Then out of fairness to the others you will be Slagathor.

  7. #7
    Hall of Famer
    Join Date
    Apr 2005
    Location
    Kingsport, TN
    Posts
    18,743
    MLB ERA
    3.62

    Re: OPS: Can We Do Better?

    When reading through this I really fell in love with the AOPS formula. I never knew BB and HBP were not calculated into SLG already. I figured TB were absolute in measuring every time a player reaches base whether it be a hit, BB, or HBP. So I have learned something there. Adding SB to the equation just further defines TB in my opinion. This should have given you a much greater statistic.

    In this AOPS case, you are familiarizing SLG with OBP a greater detail than OPS does. So essentially it is a good step in finding a stat with deeper meaning.

    The thing I find the most interesting is how the teams rank and the vast difference in their rankings after toying with SLG% (AOPS) vs giving OBP an equal weight to SLG (EOPS).

    This almost better defines clutch to me. Using these two formulas, you can see a new picture as to how teams are performing beyond BARISP. Are they providing any kind of AOPS or EOPS in order to help score runs?

    The Reds (I had to use them as an example) show that they can rank in the upper echelon of AOPS, yet still are in the lower level in runs scored. The only way to look at this is to say that they are collecting a lot of TB, BB, HBP, and SB. But that is where it stops. I guess you could look at LOB numbers for this as well, and in this case I could almost guarantee the Reds were near the top in that category last year. I am not sure there is a better way to define clutch right now. Or in the Reds case the lack thereof.

    Last thing, I wonder if these formulas are better by measuring individaul player stats vs measuring team stats?

    This is a great read Fisher. I am no stats wiz at all, but carefully reading this opened my eyes quite a bit. I learned some things with it. Excellent work.

    +rep, DIGG, delicious, YB, FB

Tags for this Thread

Posting Permissions

  • You may not post new threads
  • You may not post replies
  • You may not post attachments
  • You may not edit your posts
  •